
Agents Like Data Modelling Too
How do you get improve the quality of answers you get from Data Agents? One of the best ways to do this is structure your data so that it is easy to work with. Data Modelling turns raw and messy data into a clean and verified source of truth. We work with businesses to help them better use their valuable data and through this process come to understand both the business context and the kinds of questions the business asks of its data.
What we've found is that the same modelling practices that make data usable for human analysts also improve Agentic outcomes, and for the same reasons. Good modelling reduces the risk of errors in answering questions, and because a lot of business logic has already been applied to the raw data, both Agent and Users can join data from different source systems easily and with the knowledge that it is working with validated and trusted data.
Data Modelling
Data Modelling is the practice of taking raw, messy and disparate data and turning it into uniform, validated, accurate, well structured, documented and usable data. A lot of work is done to clean, consolidate and verify the data in this step so that it reflects accurately the state of the business and business processes. This process is essential if the business wants to rely on its proprietary data for decision making. Far from being a technical exercise, Data Modelling relies on working closely with the business to understand the data and how best to structure it so that the same data can be used to answer multiple questions.
There are a few different philosophies of Data Modelling that have stood the test of time (Inmon, Kimball, Data Vault) but as data warehouse infrastructure has become more and more powerful, the technical details of each approach have become less important. What remains useful today is the process proposed by these approaches.
Inmon
Bill Inmon's approach is often called 'top-down'. You build a centralised Enterprise Data Warehouse (EDW) which models data in the same manner as an operational database, in Third Normal Form (3NF), but integrated across the whole organisation and history. This EDW is the single source of truth and contains all data a business generates. Users don't generally query it directly; instead, simpler, easier-to-query data marts are spun off from it, usually built for specific departments or teams. These are usually built as star schemas for ease of access and use (see below).
The Inmon philosophy is to get the enterprise-wide, subject-oriented, integrated model right once, then derive everything else from it. Effectively what this means is a long and detailed mapping and design process. It can take significant amounts of time to get agreement on the enterprise model before delivering much value, and 3NF structures are hard (complex) for analysts to query directly, so the business can't use any of this work until the data marts are created.
Kimball
Ralph Kimball's approach is 'bottom-up'. You skip the normalised central warehouse and build star schemas directly: fact tables holding measurable business events (sales, shipments, clicks) at a declared grain, surrounded by denormalised dimension tables describing the who/what/where/when ('customer', 'product', 'store', 'date'). In essence, fact tables contain records of business events while dimension tables hold the description and additional data that helps give meaning to these events.
It's referred to as a star schema because of the relationship between these tables: the
fact table sits in the middle with the dimension tables radiating from it, like points on
a star. 'Denormalised' means each dimension keeps all its descriptive attributes side by
side in one wide table instead of splitting them across several linked ones. A product
dimension holds the product name, category, sub-category, brand and supplier together, so
answering 'sales by brand' takes a single join rather than 4.
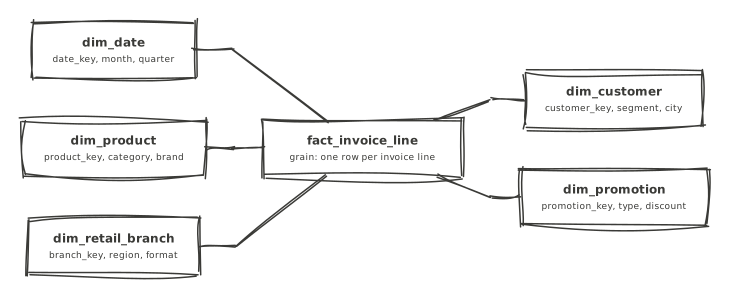 A retail sales star schema. The fact table holds the
measurements, the dimensions hold what you filter and group by.
A retail sales star schema. The fact table holds the
measurements, the dimensions hold what you filter and group by.
The 'grain' is the promise a fact table makes about what a single row represents. For example it could be 'one row per invoice line' and every fact in that table has to be true at that level.
Integration of different business entities comes from conformed dimensions: one
dimension table, reused across many business processes, meaning exactly the same thing in
each. Say sales and refunds are separate fact tables. If both join to the same customer
dimension, using the same customer keys and the same definition of what a 'customer' is,
then 'refund rate by 'customer' segment' is one straightforward query across both. If each
process carries its own idea of a 'customer', you first have to reconcile 2 sets of keys,
and the answer is only ever as good as that reconciliation. Conforming a dimension is
mostly an agreement problem: getting the business to settle on one definition of
'customer', one set of segments, and one system of record for the address.
The 'Bus Matrix' is how that agreement gets tracked. It is a grid with business processes listed vertically and dimensions horizontally, ticked wherever a process uses a dimension. It shows at a glance which dimensions are shared, and therefore which ones need conforming first.
Kimball also gave us most of the practical vocabulary in this space. Slowly changing dimensions are the patterns for handling attributes that change over time. When a customer moves house, a Type 1 dimension overwrites the old address and forgets it, while a Type 2 introduces start and end timestamps for the validity of a row, so historic invoices still show the address the goods actually went to. Factless fact tables record events with nothing to measure: a student attending a lecture, or a promotion running in a store. There is no amount to sum, but counting the rows still answers useful questions.
The strength is speed to value and query-friendliness; the risk is that without discipline around conformed dimensions, you end up with inconsistent or duplicated definitions of the same dimension.
Data Vault
Dan Linstedt's Data Vault (now Data Vault 2.0) is designed for auditability, agility, and change resilience in the raw integration layer. It decomposes everything into 3 constructs:
- Hubs: business keys only (Customer ID, Order Number), one hub per core business concept.
- Links: relationships between hubs (Customer placed Order), always many-to-many, so relationship cardinality changes never break the model.
- Satellites: all descriptive attributes and their history, hanging off hubs or links, with load timestamps and record sources on every row.
The raw vault is append-only and captures data exactly as received ("all the data, all of the time"), making it fully auditable and highly parallel to load. Like Inmon, it's not meant for end-user querying: you build dimensional marts (or 'information marts') on top. It's essentially a methodology for the middle layer, and pairs naturally with Kimball-style presentation on top.
Dimensional Modelling
We align most closely with Kimball's methodology because we deliver incrementally and work closely with clients to get feedback early on data models and products. We'll dive more deeply into how we apply the Kimball methodology below, but it's important to point out that even at this stage we use Agents to help us understand the business requirements better. Agents take interview transcripts and start highlighting key business processes and business entities we want to explore further. These are then used to give us a better sense of how the business operates and key entities that are important to it which we need to extract from the raw data and model. Agents can also reduce the toil in generating diagrams and entity maps that help discuss our understanding with clients. In Kimball's terminology the process of turning raw data into useful data models that answer a number of different questions is Dimensional Modelling.
One caveat before we get into the how. The biggest indicator of success in data projects is working closely with business and domain experts. Creating a Dimensional Model is a collaborative and iterative: you need multiple teams and perspectives represented for the model to be broadly useful. This isn't a process where you can write up a model, implement and throw it over the fence for the business to use. In fact most of the modelling time you spend on a project should be in discussions with stakeholders.
OK, that said, let's look at how you do Dimensional Modelling. Instead of modelling to meet a single department's needs, Kimball advocates for mapping business processes which can be broadly useful for the business. It's useful to start by mapping out the main business processes across the whole business, then build a backlog of models to deliver. The Bus Matrix is really useful here to make sure the entire business is talking the same language. In a retail business, for example, the business processes could include order placement, stock purchasing, invoicing and claims handling. The dimensions that are shared across these processes could be 'customer', 'product' or 'retail branch'. Mapping these out first means you can have a discussion with the business to for coverage of business processes and prioritise a single process to start with.
The 5 key steps we follow are:
- Identify the key business processes and entities
- Identify sources of data
- Declare the grain of this process
- Identify the facts
- Identify the dimensions
You can then work through the backlog one business process at a time, mapping its sources and designing its facts and dimensions. This workflow may seem arduous, but what you are doing here is really setting up a uniform approach which can be applied iteratively to model each business process. The result are datasets which join easily with each other and are easy for users to join together to answer a wide variety of questions. By doing this work upfront, it makes the data much easier to work with. Agents especially do well with this more structured format because how different entities combine is far less ambiguous and the complexity of the required SQL is greatly reduced.
1. Key Business Processes and Entities
Through interviews and review of systems, map out the key business entities (e.g. 'customer','invoices', 'purchases') and business processes (e.g. purchasing items, order fulfilment, claims handling). What you are doing in this step is to try and understand how the business operates and for the later steps which key entities are required to model a business process. We gather this information from across the business because that makes the resulting models more flexible and able to answer questions from different teams and departments.
With this list of business processes, we can prioritise and choose the most important business process to model initially. Each process should then be modelled and delivered for sign-off iteratively.
2. Identify Sources of Data
With the map of processes and entities in hand, the next step is to identify all the sources of data needed to model the chosen business process. Data might need to be extracted from third party systems, application databases or spreadsheets. Once all of these have been identified, bring these into your central data repository (data warehouse or lake) and then you've got an opportunity to see what available attributes and numbers you can work with.
3. Declare the Grain
This means specifying what each row describes in your core table. You want this to be the lowest level of detail so that you can aggregate up to different levels. To give a more concrete example, if you were modelling an invoice the lowest level grain should be an invoice line. You could model this as an invoice per row, but that could limit any analysis you want to do on line items. This is an important step, and has a big impact on the level of analysis and insight your dimensional model can provide.
4. Identify the Facts
Facts are identified by answering the question "How should the process be measured?" All
facts in a design must be true to the grain. Typical facts are numeric additive figures,
such as quantity or cost. Again using the invoice line example, you could have facts such
as quantity ordered, net price, tax and total price. Each of these facts corresponds to a
single invoice line and so sits well in this invoice_line fact table.
Now what happens if you have other attributes of the process which aren't part of an
invoice line, for example an invoice-level discount? You could either try and divide this
across all line items or you could choose to represent this in another invoice table
which contains information at the invoice level. The invoice and invoice_line tables
are connected through invoice.id.
5. Identify the Dimensions
Dimensions are all the attributes and descriptors that your stakeholders want to use to
slice or aggregate the data. These dimensions represent the 'who, what, where, when, why
and how' associated with your fact record. Dimensions are often joined to multiple fact
tables (for example the customer dimension could be useful to join with both the
invoice and refund_claims tables). Each dimension has its own grain, one row per
customer or per product, and should consolidate the versions of that entity held in
different source systems. A typical example is where multiple systems record the same
information about a customer (e.g. address or phone number). This information needs to be
conformed so it is accurate and applicable to a wide variety of use cases.
The Business Layer
Now usually the models described above are further modelled to provide easy to use Online Analytical Processing (OLAP) cubes. These are filters and aggregations of the fact tables (usually using information from the dimension tables) which allow for easier querying by downstream users. The design of this layer comes directly from user requirements and each cube will seek to provide insights from a specific perspective. For example in our sales invoice it may be revenue-focused or customer-focused. The models here should make it simple for end-users, and should be served via a dashboard or report. These cubes answer the questions the business already knows it has. New questions usually mean querying the fact and dimension tables directly.
Benefits
OK, that seemed like a lot of work. What's the benefit?
The first is performance, of both the warehouse and the users querying it. Star schemas keep every query the same shape: pick a fact table, join the dimensions you need, filter, aggregate. Modern warehouse engines are built around this pattern, so queries stay fast as fact tables grow into millions of rows. Just as usefully, the analyst never has to rebuild business logic in SQL because that work was done once, in the model.
The second is agreeing on the truth. The modelling process forces the business to settle definitions early. What counts as revenue? When does an order become a sale? Which system holds the correct customer address? These decisions are encoded in the model once, so nobody re-decides them, slightly differently, in every report. Conformed dimensions extend the agreement across processes: 'customer' means the same thing in the sales model as it does in the claims model. When 2 dashboards disagree, and they will, the model is the arbiter.
The third benefit is the process itself, and in our experience it is the most valuable. The hours spent with stakeholders declaring grains and naming facts are hours spent learning how the business actually runs. The finished Bus Matrix and Model diagrams double as documentation: a shared map of business processes that new joiners, analysts and Agents can all read.
Why It Works for Agents
Before AI, we did all of this with just business users in mind. Agents now benefit for the same reasons because an agent arrives with none of the context a human analyst develops over time.
Start with the SQL itself. LLMs have seen enormous amounts of SQL in training, and in our testing their accuracy drops sharply as joins and nesting pile up (or as complexity increases). Point an agent at a star schema and the query it needs to write is 2 or 3 joins and a group by. Answering the same question by referring to source tables may require nested subqueries, deduplication logic and knowledge of which of columns to trust. Simple schemas turn text-to-SQL from a research problem into a dependable tool.
Dimensional Modelling also codifies the grey areas. Every business has them: the flat refund applied to all May 2026 invoices, the branch that closed and had its sales reallocated elsewhere, the product codes that changed meaning after a system migration. A human analyst learns these over time (and hopefully documents them somewhere). An Agent may not even ask, and instead make incorrect assumptions to deliver a confident but incorrect answer. Baking the corrections into the model means neither of them needs to know history - the numbers have already taken the past into account.
Naming matters more than ever. An agent's first move is to read the schema, which makes
self-describing names the interface. A column called net_unit_price on a table called
invoice_line needs no explanation. A column called NETWR on a table called VBRP
needs a manual, and the agent does not have one.
Conformed dimensions then let agents combine data flexibly. Because 'customer' is the same dimension in the sales and claims models, an agent can join across business processes to answer questions nobody anticipated when the models were designed, without silently double counting along the way.
There is a limit to what structure alone can do. A well named table tells an agent how to query it. It does not say which metrics are approved, or how the business defines churn. That is the job of the semantic layer, which we will cover in a future article.
Wrap Up
The work described here is not new, in fact these concepts have been around since the 1990s. What makes them still relevant today is that there are a new type of user who respond really well to these concepts. A model built so an analyst could answer a question without asking around is exactly what an Agent (with no inbuilt memory) needs. In our experience the businesses getting dependable answers from their Agents are the ones that built these strong foundations first.
If you want some help getting your data in shape, get in touch.